The loudest junction
Bangkok's two circulating rankings of its worst junction measure vehicles and complaints. Neither measures delay — the only number anybody actually wants.
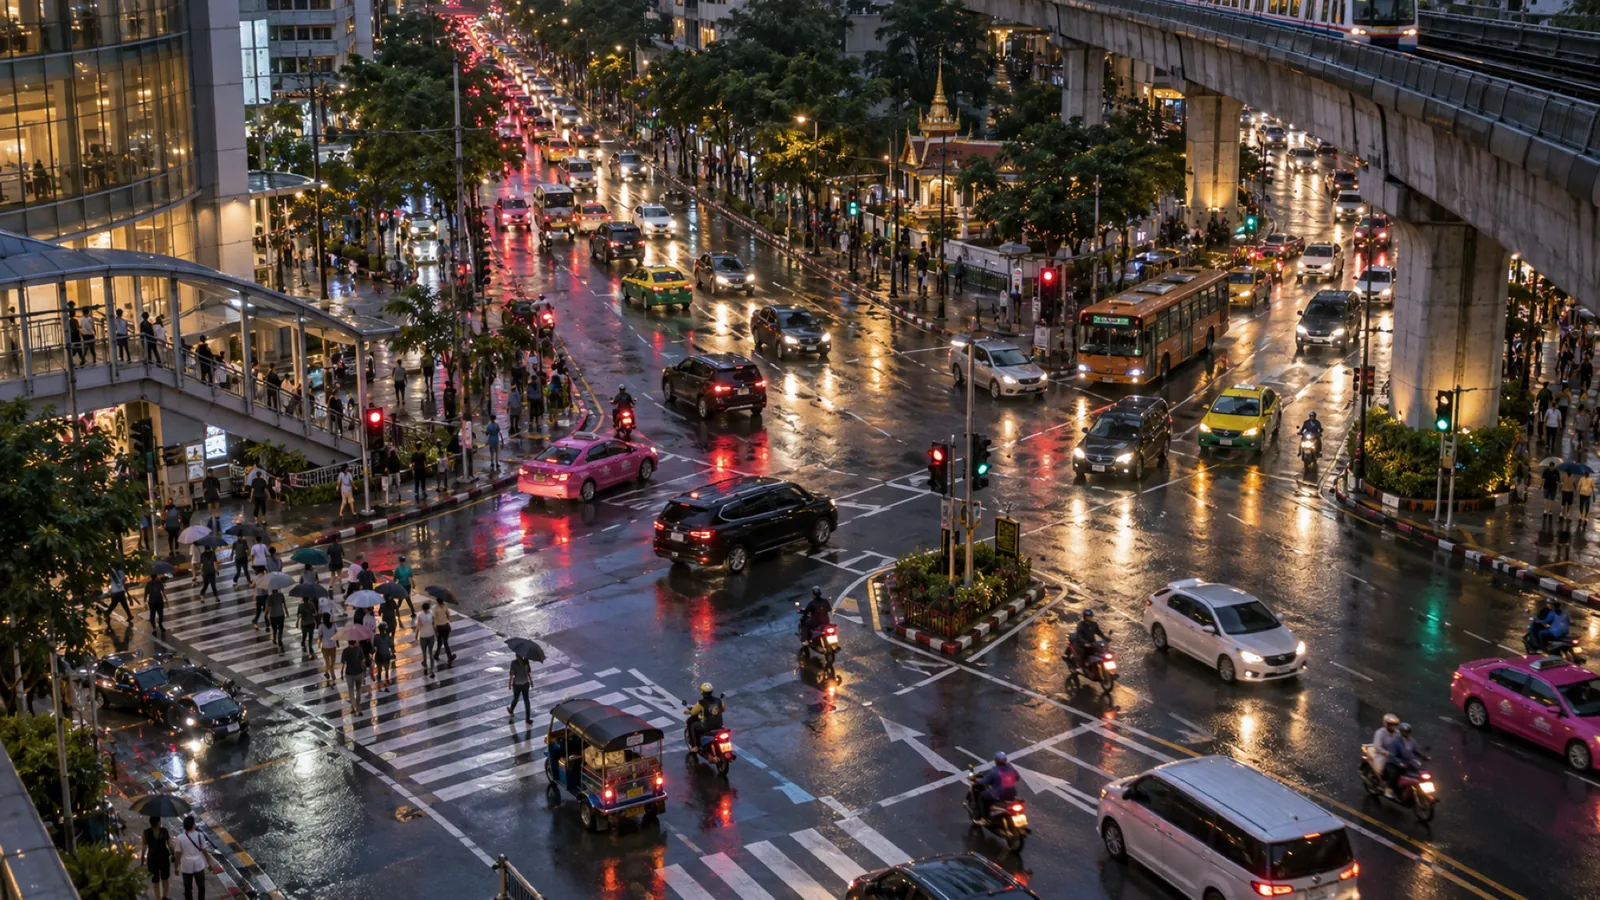
Ask which junction in Bangkok is worst and you will get a confident answer. Ask ten people and you will get several confident answers, all different, all delivered as fact.
There are two things in circulation that get called rankings. Neither is one, and the way they fail is different in each case.
List one: the vehicles
The Bangkok Metropolitan Administration’s Traffic and Transportation Department counts vehicles at junctions, and publishes the counts itself, month by month, on the city’s open data portal. This article now works from those files rather than from anybody’s report of them.
And the first thing they show is that there is no ranking.
Take July 2026, the most recent month published. The file has forty-six rows: twenty-two junctions, spread across eighteen different survey days. Almost every junction was counted once, on one day, on two or three of its road approaches. On a single day at the start of the month, counters were at Saphan Mai; nine days later, somewhere else.
It is a rota, not a league table. Nobody counted Bangkok’s junctions and put them in order. Somebody sent teams out on eighteen days and counted whatever was on the schedule.
And look at what is on the schedule. Alongside Lat Phrao and Tha Phra sit the mouth of Soi Suan Phak 23, the entrance to a housing community, and the mouth of Soi Hua Mak 28. These are not candidates for Bangkok’s worst junction. They are places where somebody needed a number, most obviously to time a signal.
Here is what the counting actually consists of. For each junction, on its survey day, on each approach road: vehicles are counted in three time bands — 07:00 to 09:00, 09:00 to 17:00, and 17:00 to 19:00 — and split into six classes: car, van, bus, minibus, truck and three-wheeler. The file records a total per approach and the junction’s coordinates.
Now notice everything that is not in that list. No speed. No delay. No queue length. No time to clear the junction. No occupancy. The department is measuring how many vehicles went through, and nothing whatever about what going through was like.
So the two-hundred-thousand figure is real and it means less than it sounds. In the July file the largest junction total is about 201,000 vehicles, at Lat Phrao, counted on one day across two approaches. The smallest is about 4,100, at a single approach on a different day. Those two numbers are not comparable and were never meant to be — different junctions, different days, different numbers of roads counted.
The Thai coverage that carried this data said as much, in a caveat almost nobody who shares the list repeats: that it does not cover every junction, and should be read as an overview of high-volume routes rather than a conclusion about which points are most congested.
Having now read the files, that caveat is if anything too gentle. The data cannot rank Bangkok’s junctions because it was not collected to.
List two: the complaints
A separate study measured something else entirely. Dataxet ran its DXT360 social listening tool across Thai social media and traditional media for the month of 1–30 November 2024, counting which Bangkok junctions people complained about.
The result:
| Junction | Share of complaints | Station responsible |
|---|---|---|
| แยกอโศก-เพชรบุรี · Asok–Phetchaburi | 41.5% | สน.มักกะสัน |
| ห้าแยกลาดพร้าว · Lat Phrao five-way | 18.0% | สน.ลาดพร้าว |
| แยกพระราม 9 · Rama 9 | 17.8% | สน.ห้วยขวาง |
| แยกสาทร-สุรศักดิ์ · Sathorn–Surasak | 15.9% | สน.ยานนาวา |
| แยกประตูน้ำ · Pratunam | 6.1% | สน.พญาไท |
Asok–Phetchaburi accounts for more than twice the complaints of the next junction and more than the bottom three combined.
And now the overlap, which an earlier version of this article said did not exist.
ห้าแยกลาดพร้าว, second on the complaints list, is also the largest single total in the BMA’s July 2026 counts — recorded as ลาดพร้าว at coordinates 13.812245, 100.559465, counted on 2 July on two approaches: Vibhavadi Rangsit at about 130,600 vehicles and Phahon Yothin at about 70,500. The identification of the two names as the same junction is from those coordinates and is mine.
That is one junction on both lists, and it proves nothing. It is there on the first because the counting rota reached it in July and it happens to sit where two of the city’s largest arteries cross; it is there on the second because a lot of people are annoyed at it. Two instruments that measure different quantities agreeing about one entry is a coincidence, not corroboration — and it is a useful reminder that a junction can be busy and irritating without either fact telling you how long anybody waited.
Now put the two lists side by side
The junction reported at the top of the volume coverage does not appear in the complaints top five at all.
Asok–Phetchaburi — the junction generating four times as many complaints as Pratunam — is not reported as the volume leader.
Not one junction appears on both lists.
That is not a contradiction to be resolved. It is two instruments measuring two different quantities, neither of which is the one in the question.
What volume actually measures
Throughput. And throughput is a measure of success.
A junction counted at 200,000 vehicles in a day is working. Something has to be functioning reasonably well for that many to get through it. High volume tells you a junction is important, not that it is broken.
The genuinely worst junction in Bangkok might carry forty thousand vehicles a day, because that is all that can physically get through it. Low volume can be a symptom rather than a reassurance — and a junction that has failed so completely that people have rerouted around it will show a falling count.
Article 114 made a version of this point about Rama II Road: the reason it cannot be closed is that there is no parallel route. Volume measures how much a link carries. It says nothing about what it costs you to use it.
What complaints actually measure
Who is stuck there, and whether they are the sort of person who posts about it.
Look at where the complaint list clusters. Asok–Phetchaburi, Rama 9, Sathorn–Surasak, Pratunam, Lat Phrao. These are the central business district, the office corridors and the retail core — the densest concentration in Thailand of commuters who are young, online, on X and Facebook during the jam, and in the habit of narrating their day.
The high-volume junctions in the counts sit largely on the city’s outer arteries. Two hundred thousand vehicles in a day includes a great many people who are not composing posts about it.
So the complaint ranking is a reasonably good measure of aggregate irritation among a specific population, and a poor measure of congestion. It is closer to a map of who has a smartphone and a grievance than to a map of where traffic fails.
Which is not a criticism of the study — it measured exactly what it said it measured, and said so. It is a criticism of how the result gets read, which is as an answer to a question it was never asked.
The number nobody publishes
The question people actually mean is: how much time does this junction cost me?
That has a proper measure — delay per vehicle, or average crossing time against free-flow time. It is not exotic. It is the standard quantity in traffic engineering and it is what a travel-time index is built from.
Navigation companies hold versions of it. Google, TomTom and Thai services like Longdo all derive junction-level delay continuously from phone and vehicle data. They publish city-level summaries, because those make headlines, and they do not publish junction-level tables.
The BMA counts vehicles. Social listening counts complaints. Delay per vehicle is measured constantly, by private companies, and is not public.
So the one number that would answer the question everybody is asking is the one number nobody puts out.
The question worth asking, which I cannot answer
Here is the thing that follows, and I am raising it as a question because I have no evidence for it.
If official attention — officers posted, signals retimed, works prioritised — responds to complaint volume, then it responds to the loudness of the people stuck rather than to the severity of the jam.
I want to be clear that I have not established that this happens. The Thai source names which police station is responsible for each junction, which is useful and is why the table above includes it. It says nothing about how resources are allocated, and neither do I.
But it is a reasonable thing to want to know, and the fact that the complaint list is the more widely circulated of the two makes it worth asking. A junction counted at 200,000 vehicles a day and no social media presence is, at minimum, easier to overlook.
Why this keeps happening
This site has now found the same shape often enough to name it.
Article 85 The tourists nobody counts found Thai domestic tourism systematically undercounted, because the counting method was built around travellers who book accommodation. Article 145 The ballot proves nothing found a selection system whose records contain nothing decisive, so the truth had to be assembled from eighty thousand pages of testimony. Article 81 The fine nobody paid found traffic fines whose enforcement depended on a mechanism that did not function.
In each case the same thing: the quantity that matters is hard to observe, an easier proxy is measured instead, and the proxy is then discussed as though it were the thing.
Volume is easy — you put a counter at a junction. Complaints are easy — you run a keyword query. Delay is harder, it belongs to companies rather than to the city, and so the public conversation is conducted entirely in proxies.
And the proxies are not neutral. Volume flatters junctions that work. Complaints flatter the districts where the complainers live.
Practically
If you are trying to plan a route, neither list will help you and you should not use either. Both are aggregates over months. Congestion at a Bangkok junction is a function of the hour, the day, the weather and whether it is the end of the month.
Use live routing, and trust it over your own conviction. The strongest finding in this article is that confident opinions about Bangkok junctions — including yours, and mine — are formed from a handful of memorable bad experiences rather than from anything measured.
If you are choosing where to live or take an office, the volume data is the more useful of the two, because it tells you which junctions are structurally load-bearing rather than which ones annoyed people last November.
If you want to report a specific problem, the Thai source is genuinely useful: junction traffic management sits with the Traffic Police Division under the Metropolitan Police Bureau, through the station covering that area, and the table above lists which station holds each of the five.
Common misconceptions
“Asok is the worst junction in Bangkok.” It is the most complained-about junction in one month’s social media. That is a different claim.
“The busiest junction is the worst one.” High volume means a junction is moving a lot of vehicles, which is evidence that it works.
“There’s official data on which junction is most congested.” There is official data on how many vehicles pass. Delay per vehicle is measured by navigation companies and is not published at junction level.
“Low traffic counts mean a junction is fine.” It can mean the opposite — that capacity has failed, or that people have rerouted.
“These lists are wrong.” Both are accurate about what they measured. The error is in reading either as an answer to “which junction costs me the most time?”
Common questions
- Which junction in Bangkok is the most congested?
- Nobody publishes the figure that would answer this. Delay per vehicle is measured by navigation companies and not released at junction level.
- Which junction carries the most vehicles?
- Nobody knows, and the BMA's own counts cannot say. They are a rolling survey — a handful of junctions counted on each of eighteen days in July 2026, most of them once — so the totals are not comparable with one another and were never collected to be. The largest single-junction total in that month's file was about 201,000 vehicles, at Lat Phrao, counted on one day across two approaches.
- Which junction do people complain about most?
- In Dataxet's November 2024 study, Asok–Phetchaburi, with 41.5% of complaint mentions — more than twice the next junction.
- Why don't the two lists agree?
- They measure different things. Volume measures throughput; complaints measure who is stuck there and whether they post about it.
- Doesn't high volume mean bad congestion?
- Not necessarily. A junction counted at 200,000 vehicles in a day is functioning. A badly failed junction may carry far fewer, because that is all that can get through it.
- Who is responsible for a specific junction?
- Traffic management sits with the Traffic Police Division under the Metropolitan Police Bureau, through the local station.